Showing posts with label Ethnicity. Show all posts

Catherine Zeta Jones Is NOT Greek

July 16, 2019

The ancestry of British actress Catherine Zeta Jones is Welsh and Irish, but people keep claiming she's part Greek, and it was just repeated in a Jeopardy question. The source is an old CNN interview she did with Larry King which was transcribed online like this:

Zeta is my grandmother's name, who is of north Greek origin. But Zeta is a Greek name. And everyone thinks that I just put Zeta in to spice up Catherine Jones. And that's completely untrue.

But there's a disclaimer at the beginning that says it's a "rush transcript" that "may not be in its final form". If she were saying that her grandmother was Greek, there would be no "But..." after the first sentence. That only makes sense if she's denying having Greek ancestry, which is what she actually said:

Zeta is my grandmother's name, who is of not Greek origin. But Zeta is a Greek name. And everyone thinks that I was, just put Zeta in to spice up Catherine Jones. And that's completely untrue. [...] I've always been called that. And in my school in Wales, Jones is a very, very popular name in Wales. And so there were like three Catherine Joneses in my class, so they always called me Zeta.

It's thought that her last name is "Zeta-Jones", but she added the hyphen later. "Zeta" was originally her middle name and her grandmother's first name, and this is where it actually came from:

"I've been performing since I was 11 years old," said Catherine, named for her maternal grandmother Catherine Fair and her paternal grandmother Zeta Jones (Zeta was the name of a ship that her great-grandfather had sailed on).

Many people have also claimed, with no evidence, that she's Hispanic or even half black because they believe Nordicist stereotypes and can't accept the fact that some Northern Europeans are naturally darker and more "exotic" looking. A sane commenter responds:

Whenever a N.European has darker hair, eyes or complexion, somebody (predictably) uses a stereotype of another ethnic group to suggest they're an "outsider" to their own heritage. Despite popular stereotypes, differences in appearance are normal within any one group due to expected genetic variation within families and their older tribal histories. This is the norm--and not the exception. Anyone proud of their heritage won't like racists taking that from them.

Catherine Zeta Jones is just a dark Brit. That's all.

What "Olive-Skinned" Really Means

June 9, 2019

Most people either think that "olive" skin tone is the same as "tan" or "dark", or that it refers to some kind of "nonwhite" or "mixed" ethnicity ranging from the Mediterranean region to Latin America. But it's actually one of several skin undertones that have nothing to do with what race or shade someone is.

When shopping for foundation, you've probably heard the terms "cool," "warm," or "neutral" to describe how a shade will look on skin. Those terms refer to your skin's undertone and are used to determine which foundation shade will match it the best.

Cool, warm, or neutral undertones are the colors that come through your skin from underneath the surface to affect its overall hue. It's not about how light or dark your skin is; people of all skin colors, from very fair to deep, can have cool, warm, or neutral undertones. Here's what each of these terms means:

Cool: Hints of bluish, pink, or a ruddy complexion.

Warm: Skin skews yellow, sallow, peachy, or golden.

Neutral: Has no obvious overtones of pink or sallow skin, but rather the skin's natural color is more evident.

[...]

Does your skin look somewhat ashen or gray? You might have the wild card of the bunch — olive skin — which is a combination of the natural neutral, slightly yellow undertone everyone has plus the greenish ashen hue that's unique to olive skin. Olive skin tone is very specific, but is not neutral, as some tend to call it.

Here's what the 4 different undertones would look like on light untanned skin:


And here are people of different races and shades with 3 of the undertones:

Ancestry of Latinos

June 12, 2013

As they say, Hispanic is not a race. Latin Americans are a three-way mix of Europeans (from Spain), Native American Indians, and Sub-Saharan Africans, but proportions of these genetic components vary a lot both between and within different groups.

We find that the most likely source of the indigenous ancestry in Caribbean islanders is a Native South American component shared among coastal tribes from Venezuela, Central America, and the Yucatan peninsula, suggesting extensive gene flow across the Caribbean in pre-Columbian times. We find evidence of two pulses of African migration. The first pulse — which today is reflected by shorter, older ancestry tracts — consists of a genetic component more similar to coastal West African regions involved in early stages of the trans-Atlantic slave trade. The second pulse — reflected by longer, younger tracts — is more similar to present-day West-Central African populations, supporting historical records of later transatlantic deportation. Surprisingly, we also identify a Latino-specific European component that has significantly diverged from its parental Iberian source populations, presumably as a result of small European founder population size.

[...]

Figure 1B shows the distribution in PCA space of each individual, recapitulating clustering patterns previously observed in Hispanic/Latino populations: Mexicans cluster largely between European and Native American components, Colombians and Puerto Ricans show three-way admixture, and Dominicans principally cluster between the African and European components. Ours is the first study to characterize genomic patterns of variation from (1) Hondurans, which we show have a higher proportion of African ancestry than Mexicans, (2) Cubans, which show extreme variation in ancestry proportions ranging from 2% to 78% West African ancestry, and (3) Haitians, which showed the largest average proportion of West African ancestry (84%).


Assuming a K=3 admixture model, population admixture patterns are driven by continental reference samples with no continental subdivision (Figure 1C, top panel). However, higher Ks show substantial substructure in all three continental components. [...] At K=8, when the clinal gradient of differentiation between Southern and Northern Europeans appears, the Latino European component is seen only in low proportions in individuals from Portugal and Spain, whereas it is the major European component among Latinos (Figure 1C, bottom panel).


ADMIXTURE clustering analysis using the high-density dataset containing approximately 390K autosomal SNP loci in common across admixed and reference panel populations. Unsupervised models assuming K=3 and K=8 ancestral clusters are shown. At K=3, Caribbean admixed populations show extensive variation in continental ancestry proportions among and within groups. At K=8, sub-continental components show differential proportions in recently admixed individuals. A Latino-specific European component accounts for the majority of the European ancestry among Caribbean Latinos and is exclusively shared with Iberian populations within Europe. Notably, this component is different from the two main gradients of ancestry differentiating southern from northern Europeans. Native Venezuelan components are present in higher proportions in admixed Colombians, Hondurans, and native Mayans.


Moreno-Estrada et al. "Reconstructing the Population Genetic History of the Caribbean". PLOS Genetics, 2013.

EU Overweight and Obesity Statistics

February 21, 2012

This article presents recent statistics on overweight and obesity in the European Union (EU). Weight problems and obesity are increasing at an alarming rate: over the last decade the proportion of the population that is overweight has increased considerably in most Member States, resulting in more than half the EU population being overweight or obese.

Obesity is a serious public health problem, as it significantly increases the risk of chronic diseases such as cardiovascular disease, type-2 diabetes, hypertension, coronary-heart diseases and certain cancers. For individuals, psychological problems associated with obesity are common, wide-ranging and potentially serious. For society, obesity has substantial direct and indirect costs that put a strain on healthcare and social resources.

Among the 19 Member States for which data are available, the proportion of overweight and obese people in the adult population varied in 2008/09 between 36.9 % and 56.7 % for women and between 51 % and 69.3 % for men.

For both women and men aged 18 years and over, the lowest shares of obesity in 2008/09 were observed in Romania (8.0 % for women and 7.6 % for men), Italy (9.3 % and 11.3 %), Bulgaria (11.3 % and 11.6 %) and France (12.7 % and 11.7 %). The highest proportions of obese women were recorded in the United Kingdom (23.9 %), Malta (21.1 %), Latvia (20.9 %) and Estonia (20.5 % in 2006), and of men in Malta (24.7 %), the United Kingdom (22.1 %), Hungary (21.4 %) and the Czech Republic (18.4 %).

There is no systematic difference in obesity between women and men across the Member States available. The proportion of obesity was higher for women in eight Member States, higher for men in ten and equal in one. However, for overweight there is a clear gender difference: in all Member States available the proportion of overweight men is much higher than for women (differences from 8.5 % in Hungary to 18.2 % in Slovenia).


The share of overweight and obese persons increases with age. The average difference between the youngest and oldest age groups is for men around 44 % and for women around 53 %. For women there is a clear pattern in all the Member States available: the older the age group, the higher the share of overweight and obese persons. For men, the pattern is a little different: increase of overweight and obesity is systematic till 65. For the age group 65-74 the picture is less uniform: For seven of the Member States available the highest share of overweight and obese men was recorded for the age group 65-74.


The share of overweight and obese persons tends to fall with educational level. For women, the pattern is clear in all Member States available: the proportion of women who are obese or overweight falls as the educational level rises. For women the differences between lower and upper education level vary between 12.8 and 36.7 %. For men, the pattern is again slightly different. Differences are smaller and the distribution is different: in 8 of the available Member States, the highest share of overweight and obese men is observed for those with the lowest educational level, in six Member States for those with a medium educational level while in 4 countries it is for those with a high educational level.


Overweight and Obesity — BMI Statistics. Eurostat — Statistics Explained, 2012.

Western Europe's Attitudes About Immigration

September 29, 2011

These are the results of two recent surveys about immigration conducted in Italy, Spain, France, Britain, Germany and Sweden as part of the Pew Global Attitudes Project.

Italy was the only country of the Western European nations surveyed where a majority viewed the impact of immigrants negatively. Publics in Britain, France, Germany and Spain were divided, while the Swedes had an overwhelmingly positive view of the influence immigrants had on their country.

While the recent anti-immigrant violence has been directed at Africans, Italians expressed equally negative views of immigration from Eastern European countries as they do about immigration from the Middle East and Africa. Two-thirds said it was a bad thing that people from the Middle East and North Africa come to live and work in Italy; an equal number said the same about immigrants from Eastern Europe.

Only about one-in-five Italians saw immigration from the Middle East and Africa and Eastern Europe as a good thing for Italy (20% and 22%, respectively).
Germans were also largely unwelcoming of immigrants. Solid majorities in Germany said it was bad that people from the Middle East and North Africa (64%) and from Eastern Europe (58%) moved to their country.

Opinions were more mixed in Spain and France, while many more in Britain and Sweden said immigration from the Middle East and North African and from Eastern European countries was a good thing than said it was a bad thing.

[...]

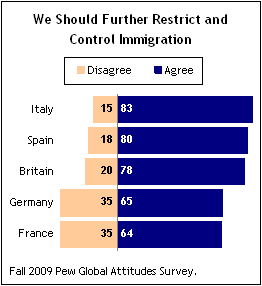
A fall 2009 survey found that more than eight-in-ten Italians (83%) agreed that "we should restrict and control entry into our country more than we do now," including 40% who completely agreed with the statement.

Majorities in the other Western European countries included in the 2009 poll also expressed support for tougher restrictions on immigration. About eight-in-ten in Spain (80%) and Britain (78%) shared that view, as did 65% in Germany and 64% in France.


Juliana Menasce Horowitz. "Widespread Anti-Immigrant Sentiment in Italy". Pew Global Attitudes Project, 2010.

Related: Italians Are Anti-Immigration and Pro-Italy

Race and Ethnicity Gallery

July 29, 2006

Collection of photo series depicting people of different races and ethnicities from various walks of life. In each series, concerted effort has been made to exclude individuals with backgrounds other than that stated. Corrections and suggestions are welcome.

http://racialreality.shorturl.com/gallery.html

I hope to add more galleries in the future. If anyone has any ideas (and more importantly picture sources), leave a comment or drop me a line.

'Star Wars' Stereotypes

November 12, 2005

Amusing Flash page parodying the ethnically questionable characters from the most recent Star Wars trilogy:

http://www.flakmag.com/flash/swdvd.html

Asians Getting Surgery to Look Western

October 9, 2004

Changing Faces


...and thighs, calves, busts — you name it. From Seoul to Surabaya, Asians are turning to cosmetic surgery like never before. Lisa Takeuchi Cullen Investigates


Time Asia, 2004

[...]

Around Asia, women — and increasingly, men — are nipping and tucking, sucking and suturing, injecting and implanting, all in the quest for better looks. In the past, Asia had lagged behind the West in catching the plastic surgery wave, held back by cultural hang-ups, arrested medical skills and a poorer consumer base. But cosmetic surgery is now booming throughout Asia like never before. In Taiwan, a million procedures were performed last year, double the number from five years ago. In Korea, surgeons estimate that at least one in 10 adults have received some form of surgical upgrade and even tots have their eyelids done. The government of Thailand has taken to hawking plastic surgery tours. In Japan, noninvasive procedures dubbed "petite surgery" have set off such a rage that top clinics are raking in $100 million a year.

[...]

The culturally loaded issue today is the number of Asians looking to remake themselves to look more Caucasian. It's a charge many deny, although few would argue that under the relentless bombardment of Hollywood, satellite TV, and Madison Avenue, Asia's aesthetic ideal has changed drastically. "Beauty, after all, is evolutionary," says Harvard psychology professor Nancy Etcoff, who is the author of Survival of the Prettiest: The Science of Beauty — not coincidentally a best seller in Japan, Korea, Hong Kong and China. Asians are increasingly asking their surgeons for wider eyes, longer noses and fuller breasts — features not typical of the race. To accommodate such demands, surgeons in the region have had to invent unique techniques. The No. 1 procedure by far in Asia is a form of blepharoplasty, in which a crease is created above the eye by scalpel or by needle and thread; in the U.S., blepharoplasty also ranks near the top, but involves removing bags and fat around the eyes. Likewise, Westerners use botox, or botulinum toxin, to diminish wrinkles — while in Korea, Japan and Taiwan, botox is injected into wide cheeks so the muscle will atrophy and the cheeks will shrink.

Just as Asian faces require unique procedures, their bodies demand innovative operations to achieve the leggy, skinny, busty Western ideal that has become increasingly universal. Dr. Suh In Seock, a surgeon in Seoul, has struggled to find the best way to fix an affliction the Koreans call muu-dari and the Japanese call daikon-ashi: radish-shaped calves. Liposuction, so effective on the legs of plump Westerners, doesn't work on Asians since muscle, not fat, accounts for the bulk. Suh says earlier attempts to carve the muscle were painful and made walking difficult. "Finally, I discovered that by severing a nerve behind the knee, the muscle would atrophy," says Suh, "thereby reducing its size up to 40%." Suh has performed over 600 of the operations since 1996. He disappears for a minute and returns with a bottle of fluid containing what looks like chopped up bits of ramen noodles. He has preserved his patients' excised nerves in alcohol. "And that's just since November," he says proudly.

Link

'Celts' Are Not Really Celtic

September 17, 2004

Famous 'Celtic' nations may be misnamed


Genetic studies hint at unexpected origins of clans


Sept. 9, 2004

DUBLIN, Ireland - Celtic nations like Ireland and Scotland have more in common with the Portuguese and Spanish than with "Celts" — the name commonly used for a group of people from ancient Alpine Europe, scientists say.

"There is a received wisdom that the origin of the people of these islands lie in invasions or migrations ... but the affinities don't point eastwards to a shared origin," said Daniel Bradley, co-author of a genetic study into Celtic origins.

Early historians believed the Celts — thought to have come from an area to the east of modern France and south of Germany — invaded the Atlantic islands around 2,500 years ago.

But archaeologists have recently questioned that theory, and now Bradley, from Trinity College Dublin, and his team, say DNA evidence supports their thinking.

Geneticists used DNA samples from people living in Celtic nations and compared the genetic traits with those of people in other parts of Europe.

The study showed that people in Celtic areas — Wales, Scotland, Ireland, Brittany and Cornwall — had strong genetic ties, but that this heritage had more in common with people from the Iberian Peninsula.

"What we would propose is that this commonality among the Atlantic facade is much older ... 6,000 years ago or earlier," Bradley told Reuters.

He said people may have moved up from areas around modern-day Portugal and Spain at the end of the Ice Age.

The similarities between Atlantic "Celts" could also suggest these areas had good levels of communications with one another, he added.

But the study could not determine whether the common genetic traits meant "Celtic" nations would look alike or have similar temperaments. Dark or red hair and freckles are considered Celtic features.

Link

Stats on U.S. Ethnic Groups

September 10, 2004

Here are some interesting statistics from Michael Barone's book The New Americans, which contrasts the experiences of past Irish, Italian and Jewish immigrants with those of modern Blacks, Hispanics and Asians (respectively). The stats are quoted from a review of the book at FrontPage Magazine.

  • By 1990 Italian-Americans earned income 17 percent above the national average and were 50 percent more likely to have college degrees.
  • ...during the Al Capone era in Chicago, only 30 percent of those in organized crime were Italian-Americans, while 29 percent were Irish-Americans and 20 percent were Jewish.
  • By 1937, Jews were 25 percent of the population of New York City — but 65 percent of lawyers, 64 percent of dentists, and 55 percent of physicians in the city were Jews.
  • ...Jewish-Americans who were 4 percent of the U.S. population in the 1930s have declined to only 2 percent today. Intermarriage with non-Jews characterized 50 percent of their marriages during the 1990s, with only 28 percent of children from such marriages being raised as Jews and only 20 percent getting Jewish religious education.
  • By 1960 more than 75 percent of Jewish-Americans voted Democratic or even farther to the Left.
  • By 1995, Asian-Americans were 4 percent of America's population but 14 percent of all those scoring 700+ on the verbal Scholastic Aptitude Test and 28 percent of those scoring 750+ on the math portion of the SAT.
  • Today Asian-Americans are 19 percent of all students at Harvard, 28 percent at MIT, 22 percent at Stanford, 39 percent at Berkeley, 38 percent at UCLA, and 10 percent at the University of Michigan.

Ukrainians: Plates

September 7, 2004

Photographic survey of racial variation in the Ukraine, from the Slavic Anthropology website.

http://www.slavanthro.org/ukranians.html

Representative samples:


Group Photo of French Basques

September 2, 2004

Basques are a pretty good standard of "Europeanness" since they're known to be of extremely old stock and virtually free of later admixture. Below is a large random sampling of French Basques who, according to Coon, are even lighter than Spanish Basques. Yet still, almost all of them have dark brown hair, and a few would no doubt appear mixed or non-European to the average American.

Emotion and Ethnicity

August 27, 2004

Variation among European Americans in Emotional Facial Expression


Tsai et al. (2003)
Journal of Cross-Cultural Psychology

ABSTRACT: The authors examined whether European Americans (EA) several generations removed from their ancestors varied as a function of their countries of origin by comparing the emotional facial expressions of EA originally from Scandinavian countries (EA-S), who value emotional control, and those from Ireland (EA-I), who value emotional expression. EA-S were less expressive than EA-I while reliving various emotions, especially happiness and love, suggesting that in this domain, EAs continue to be influenced by their cultural heritages.

Link (PDF)

Separatist and Regionalist Movements

August 25, 2004

This is a good resource detailing in brief the regions of the world desiring sovereignty, with links to additional information on each movement:

http://www.oocities.org/uripi/separatist.html

Included are trouble spots such as Tibet, Kashmir, Kurdistan, Chechnya, Euskadi (Basque Territory), Corsica, Ulster (N Ireland) and Quebec; well-known secessionists like Padania and Ausonia (N and S Italy), Gymru (Wales), Hawaii, Texas and Puerto Rico; and a few surprises like Occitania (S France), Bayern (Bavaria), Okinawa, New England and Western Canada.