Showing posts with label Demographics. Show all posts

Phoenicians and Moors Were Caucasoid

August 20, 2020

Afrocentrists claim that Phoenicians and Moors were black, but most of these ancient samples from colonies in Iberia are a mix of North African, Levantine and Southern European (Local Iberian), clustering very close to Europeans because North Africans are Caucasoid. Only two samples from the later Muslim period have Sub-Saharan African admixture (37% and 48%) and they cluster far away from the rest. Modern Iberians have much less of all this admixture (~7% North African and 0% Sub-Saharan African) and cluster with other Europeans.

In the southeast, we recovered genomic data from 45 individuals dated between the 3rd and 16th centuries CE. All analyzed individuals fell outside the genetic variation of preceding Iberian Iron Age populations (Fig. 1, C and D, and fig. S3) and harbored ancestry from both Southern European and North African populations (Fig. 2D), as well as additional Levantine-related ancestry that could potentially reflect ancestry from Jewish groups (21). These results demonstrate that by the Roman period, southern Iberia had experienced a major influx of North African ancestry, probably related to the well-known mobility patterns during the Roman Empire (22) or to the earlier Phoenician-Punic presence (23); the latter is also supported by the observation of the Phoenician-associated Ychromosome J2 (24). Gene flow from North Africa continued into the Muslim period, as is clear from Muslim burials with elevated North African and sub-Saharan African ancestry (Fig. 2D, fig. S4, and table S22) and from uniparental markers typical of North Africa not present among pre-Islamic individuals (Fig. 2D and fig. S11). Present-day populations from southern Iberia harbor less North African ancestry (25) than the ancient Muslim burials, plausibly reflecting expulsion of moriscos (former Muslims converted to Christianity) and repopulation from the north, as supported by historical sources and genetic analysis of present-day groups (25). The impact of Muslim rule is also evident in northeast Iberia in seven individuals from Sant JuliĆ  de Ramis from the 8th to 12th centuries CE who, unlike previous ancient individuals from the same region, show North African–related ancestry (Fig. 2C and table S19) and a complete overlap in PCA with present-day Iberians (Fig. 1D).


Olalde et al. "The genomic history of the Iberian Peninsula over the past 8000 years". Science, 2019.

Related: Moors Expelled from Sicily and Southern Italy

Ancestry of Latinos

June 12, 2013

As they say, Hispanic is not a race. Latin Americans are a three-way mix of Europeans (from Spain), Native American Indians, and Sub-Saharan Africans, but proportions of these genetic components vary a lot both between and within different groups.

We find that the most likely source of the indigenous ancestry in Caribbean islanders is a Native South American component shared among coastal tribes from Venezuela, Central America, and the Yucatan peninsula, suggesting extensive gene flow across the Caribbean in pre-Columbian times. We find evidence of two pulses of African migration. The first pulse — which today is reflected by shorter, older ancestry tracts — consists of a genetic component more similar to coastal West African regions involved in early stages of the trans-Atlantic slave trade. The second pulse — reflected by longer, younger tracts — is more similar to present-day West-Central African populations, supporting historical records of later transatlantic deportation. Surprisingly, we also identify a Latino-specific European component that has significantly diverged from its parental Iberian source populations, presumably as a result of small European founder population size.

[...]

Figure 1B shows the distribution in PCA space of each individual, recapitulating clustering patterns previously observed in Hispanic/Latino populations: Mexicans cluster largely between European and Native American components, Colombians and Puerto Ricans show three-way admixture, and Dominicans principally cluster between the African and European components. Ours is the first study to characterize genomic patterns of variation from (1) Hondurans, which we show have a higher proportion of African ancestry than Mexicans, (2) Cubans, which show extreme variation in ancestry proportions ranging from 2% to 78% West African ancestry, and (3) Haitians, which showed the largest average proportion of West African ancestry (84%).


Assuming a K=3 admixture model, population admixture patterns are driven by continental reference samples with no continental subdivision (Figure 1C, top panel). However, higher Ks show substantial substructure in all three continental components. [...] At K=8, when the clinal gradient of differentiation between Southern and Northern Europeans appears, the Latino European component is seen only in low proportions in individuals from Portugal and Spain, whereas it is the major European component among Latinos (Figure 1C, bottom panel).


ADMIXTURE clustering analysis using the high-density dataset containing approximately 390K autosomal SNP loci in common across admixed and reference panel populations. Unsupervised models assuming K=3 and K=8 ancestral clusters are shown. At K=3, Caribbean admixed populations show extensive variation in continental ancestry proportions among and within groups. At K=8, sub-continental components show differential proportions in recently admixed individuals. A Latino-specific European component accounts for the majority of the European ancestry among Caribbean Latinos and is exclusively shared with Iberian populations within Europe. Notably, this component is different from the two main gradients of ancestry differentiating southern from northern Europeans. Native Venezuelan components are present in higher proportions in admixed Colombians, Hondurans, and native Mayans.


Moreno-Estrada et al. "Reconstructing the Population Genetic History of the Caribbean". PLOS Genetics, 2013.

Racial Composition and History of India

December 10, 2012

DNA evidence confirms what historians, linguists and anthropologists have long known but nationalists have denied: that Indians are mainly a mix of indigenous Australoids and intrusive Caucasoids. They're composed of two genetic components, one related to Andaman Islanders and the other to Western Eurasians, which is higher in upper castes. The estimated dates of admixture between the two are consistent with the introduction of Indo-Aryan languages from the northwest and probably also earlier events related to the spread of Dravidian languages and even agriculture.

India has been underrepresented in genome-wide surveys of human variation. We analyse 25 diverse groups in India to provide strong evidence for two ancient populations, genetically divergent, that are ancestral to most Indians today. One, the "Ancestral North Indians" (ANI), is genetically close to Middle Easterners, Central Asians, and Europeans, whereas the other, the "Ancestral South Indians" (ASI), is as distinct from ANI and East Asians as they are from each other. By introducing methods that can estimate ancestry without accurate ancestral populations, we show that ANI ancestry ranges from 39-71% in most Indian groups, and is higher in traditionally upper caste and Indo-European speakers. Groups with only ASI ancestry may no longer exist in mainland India. However, the Andamanese are an ASI-related group without ANI ancestry, showing that the peopling of the islands must have occurred before ANI-ASI gene flow on the mainland. Allele frequency differences between groups in India are larger than in Europe, reflecting strong founder effects whose signatures have been maintained for thousands of years owing to endogamy. We therefore predict that there will be an excess of recessive diseases in India, which should be possible to screen and map genetically.


Reich et al. "Reconstructing Indian Population History". Nature, 2009.


Metspalu et al. "Shared and Unique Components of Human Population Structure and Genome-Wide Signals of Positive Selection in South Asia". Am J Hum Genet, 2011.

Linguistic and genetic studies have shown that most Indian groups have ancestry from two genetically divergent populations, Ancestral North Indians (ANI) and Ancestral South Indians (ASI). However, the date of mixture still remains unknown. We analyze genome-wide data from about 60 South Asian groups using a newly developed method that utilizes information related to admixture linkage disequilibrium to estimate mixture dates. Our analyses suggest that major ANI-ASI mixture occurred in the ancestors of both northern and southern Indians 1,200-3,500 years ago, overlapping the time when Indo-European languages first began to be spoken in the subcontinent. These results suggest that this formative period of Indian history was accompanied by mixtures between two highly diverged populations, although our results do not rule out other, older ANI-ASI admixture events. A cultural shift subsequently led to widespread endogamy, which decreased the rate of additional population mixtures.

Moorjani et al. "Estimating a date of mixture of ancestral South Asian populations", Evolutionary and Population Genetics, 2012.

The paper provides an overview of the spatial and temporal aspects of human morphological variation in India. Four morphological types — Australoids, Negritos, Mongoloids and Caucasoids — have been discerned in the contemporary Indian population. The Australoids appear to be the oldest and have evolved in India. The Caucasoids are physically heterogeneous and suggests incorporation of more than one physical type involving more than one migration. The within-type variance compared to between-type variance for characters studied is smaller. The paper further discusses the observed variability in terms of Indian social organization as well as in terms of endogamy, small numerical strength of the groups and varying ecological conditions prevalent in India.

K.C. Malhotra. "Morphological Composition of the People of India". J Hum Evol, 1978.


Indian Male Composite
Indian Female Composite


Assumed parental groups:


Andamanese Australoid
Iranian Caucasoid


Degrees of admixture:


Austroasiatic speaker
(Juang)
Austroasiatic speaker
(Santhal)


Dravidian speaker
(Paniya)
Dravidian speaker
(Hallaki)


Indo-European speaker
(Meghawal)
Indo-European speaker
(Kashmiri Pandit)

EU Overweight and Obesity Statistics

February 21, 2012

This article presents recent statistics on overweight and obesity in the European Union (EU). Weight problems and obesity are increasing at an alarming rate: over the last decade the proportion of the population that is overweight has increased considerably in most Member States, resulting in more than half the EU population being overweight or obese.

Obesity is a serious public health problem, as it significantly increases the risk of chronic diseases such as cardiovascular disease, type-2 diabetes, hypertension, coronary-heart diseases and certain cancers. For individuals, psychological problems associated with obesity are common, wide-ranging and potentially serious. For society, obesity has substantial direct and indirect costs that put a strain on healthcare and social resources.

Among the 19 Member States for which data are available, the proportion of overweight and obese people in the adult population varied in 2008/09 between 36.9 % and 56.7 % for women and between 51 % and 69.3 % for men.

For both women and men aged 18 years and over, the lowest shares of obesity in 2008/09 were observed in Romania (8.0 % for women and 7.6 % for men), Italy (9.3 % and 11.3 %), Bulgaria (11.3 % and 11.6 %) and France (12.7 % and 11.7 %). The highest proportions of obese women were recorded in the United Kingdom (23.9 %), Malta (21.1 %), Latvia (20.9 %) and Estonia (20.5 % in 2006), and of men in Malta (24.7 %), the United Kingdom (22.1 %), Hungary (21.4 %) and the Czech Republic (18.4 %).

There is no systematic difference in obesity between women and men across the Member States available. The proportion of obesity was higher for women in eight Member States, higher for men in ten and equal in one. However, for overweight there is a clear gender difference: in all Member States available the proportion of overweight men is much higher than for women (differences from 8.5 % in Hungary to 18.2 % in Slovenia).


The share of overweight and obese persons increases with age. The average difference between the youngest and oldest age groups is for men around 44 % and for women around 53 %. For women there is a clear pattern in all the Member States available: the older the age group, the higher the share of overweight and obese persons. For men, the pattern is a little different: increase of overweight and obesity is systematic till 65. For the age group 65-74 the picture is less uniform: For seven of the Member States available the highest share of overweight and obese men was recorded for the age group 65-74.


The share of overweight and obese persons tends to fall with educational level. For women, the pattern is clear in all Member States available: the proportion of women who are obese or overweight falls as the educational level rises. For women the differences between lower and upper education level vary between 12.8 and 36.7 %. For men, the pattern is again slightly different. Differences are smaller and the distribution is different: in 8 of the available Member States, the highest share of overweight and obese men is observed for those with the lowest educational level, in six Member States for those with a medium educational level while in 4 countries it is for those with a high educational level.


Overweight and Obesity — BMI Statistics. Eurostat — Statistics Explained, 2012.

Geography and Industry

December 30, 2011

Continuing on the theme of environment significantly shaping development and history, here we see how the uneven distribution, quality and accessibility of coal reserves determined the course of the industrial revolution, and how geography also had a major impact on the newer alternative energy source of hydroelectricity, determining which countries (or parts of countries) would be able to play catch up.

The objective of this article is to analyse the importance of one of the new energy sources, electricity, since the end of the nineteenth century until 1945, from the point of view of natural resource endowments. Not all countries had good or equivalent endowments of coal, the energy-producing mineral of the nineteenth century, and for this reason not all of them had the same opportunities to use it, given that the transport cost was very high due to its weight in relation to its caloric power. Electricity reduced the dependence on coal resources as it could be produced not only from coal but also from water.

[...]

The accessible coal endowments available at that time can be proxied by the reserve estimates elaborated by the Geological Survey of Canada in a monograph prepared for the Twelfth International Geological Congress, which was held in Canada in 1913. These estimations are presented in Table 1, both in the form of total coal reserves and coal reserves per capita in each country. Well endowed in coal were Canada and the US in North America and Germany, the UK, Austria and — in an intermediate position — France in Europe. The Northern European countries Denmark and Sweden and the Southern European countries Italy, Greece and Portugal all had poor coal endowments. Looking at coal quality, Spain and especially Italy lacked good quality coal; as for the cost of extraction, this was particularly high in France and Spain, due to the characteristics of its seams.


The differences of national coal endowments are reflected by the levels of coal prices at colliery (see Table 2). We find lower coal prices in the USA, the UK and Germany than in France and Spain, and these differences were substantial. We can see how in the case of France and Spain, where extraction costs were significantly higher, the prices at colliery were too. However, in France, contrary to Spain, the coal reserves were closer to the industrial centres, and these centres were also closer to other coal producing countries. Italy, due to her scarcity of coal, imported coal from the UK through Genoa, with the resulting difference in prices with respect to the other above mentioned countries (see Table 2).


Despite the reduction in transport cost at the end of the nineteenth century, resort to imported coal significantly increased its price. Coal is heavy and bulky in relation to its unit value. Moreover, the differences in transport costs between countries close to and far away from coal production centres persisted over time. In Table 3 the average freight rates from Cardiff to different ports in 1909-1911 are shown. The freight rates to the closest continental harbours were about 4.5 shillings (s.) per tonne on average, but they ranked from 5.5 s. to 7 s. per tonne to the Mediterranean. For example, in the case of Barcelona, the industrial centre of Spain, the rate was 7.42 s. per tonne, and in Genoa it was 7.08 s., both of them being amongst the highest.


[...]

Natural resources also had effects on the type of electricity being produced in these countries when electricity eventually arrived. In the case of the USA, the main thermoelectric power plants were located in the regions along the Mid-Atlantic coast and in the North-East-Central industrial belt. In 1932, they represented 57 per cent of total installed power, 65 per cent of the electricity production in the USA, and 70 per cent and 75 per cent of the installed power and production, respectively, of thermoelectricity. The main hydroelectricity power plants clustered in the coastal regions of the Atlantic (New York State, Pennsylvania, Maryland, North and South Carolina, Georgia and Alabama) and along the Pacific (in California). In 1932, the former regions represented 45 per cent of the hydroelectricity production, and California 30 per cent.

In the UK, as mentioned above, the coal resources were extensive and of good quality. This country had less access to waterpower with the exception of the Highlands in Scotland. Even the locations of coal seams were favourable, as they were distributed all over the country. This created a great advantage in terms of low coal prices for the country as a whole. In the advent of electricity, the main primary energy source became steam to produce thermoelectricity, and small local plants were established close to the location of coal mines.

In France, however, the coal fields were located in the regions of Pas de Calais, the North, Lorraine (Moselle), the Central Massif (Saint-Etienne, Creusot, Gard, etc.) and the Saar (between 1925 and 1935). National production represented around two-thirds of the needs of the country, and the rest was imported from countries near to centres of production and consumption. The coal mining districts mentioned above were important industrial centres, which, time passing, became users of thermoelectricity. Water resources were substantial in the regions of the Alps and the Pyrenees, both well endowed with high falls of little flow, and in the Central Massif, where there were wide rivers. These regions, situated far from the important coal seams, used hydroelectric energy and were centres of the electrochemical and the electrometallurgical industries, which require cheap and abundant supplies of electric energy. The proportion of thermoelectricity was 57.3 per cent, the remainder being hydroelectricity.

The situation was worst in Italy because of the scarcity of coal and its low caloric power. As a result, coal had to be imported. For that reason, electricity was generated by hydraulic power, once the problem of long distance transmission was solved by means of the alternating current. The most important hydraulic resources were concentrated in the Alps and the Po Valley, between the Alps and the Apennines in the North of the country. The regions endowed with the most important sources of waterpower were the Piedmont and Lombardy, the Po Valley (Adda, Adige, Ticino, Tevere, etc.), the Venetia region and that of Umbria.

The situation was different in Spain. As we have seen in Table 1, the coal resources were better than those of Sweden and Italy, worse than those in the United Kingdom and Germany, and similar — in per capita terms — to the case of France. The problem was the quality of Spanish coal as well as its difficult extraction and, hence, its high cost of production. Moreover, the most important coal resources were located in the Asturias region, in the North of Spain, close to the sea side but difficult to transport out because of the mountains that enclose the region. Given its inaccessibility, a substantial part of coal consumption was supplied through foreign trade with the inconvenience of high transport costs. Spain's hydraulic resources were better than its coal resources, but not as abundant as in Italy, Sweden, Norway or Switzerland. Falls were located in the Pyrenees and the Penibetic range. The rivers had small flows, but they did occupy high grounds, which represented an advantage for electricity production. The rivers with the best flow conditions were the Ebro, the Douro and the Tagus. The disadvantage of a low flow is that this makes it very much dependent on year over weather conditions, making a substantial investment in dams necessary to stock water.

We have calculated the proportion of hydroelectricity and thermoelectricity in the total electricity production of each country. As shown in Figure 1, at the top of the countries using hydroelectricity were Canada, Italy and Spain. Hydroelectricity accounted for over 80 per cent of their electricity production. At the bottom, using less than 60 per cent, as already commented, were the coal intensive countries, i.e. the UK, the USA, and France, although, France had a lesser proportion of thermoelectricity.


[...]

In short, an advanced electrification process is observed in the countries less endowed with coal, such as in Spain, Italy and the Northern European countries, in spite of their different levels of economic development. On the other hand, the countries that were the last ones in electrifying their industries were the countries blessed with better coal endowments, such as the UK, Germany and France. The exception among them corresponds to the USA, which had good endowments of both resources.

[...]

The degree of electrification advanced substantially from the end of the nineteenth century until WWII, the height of the process being 1925, after WWI, when real electricity prices fell considerably. The behaviour of the relative prices electricity-coal, coupled with the new technical opportunities for electrification in the manufacturing sector where electricity competed with steam, produced important possibilities for economic growth. There was also a relationship between the accumulation of physical capital and electrification process and the increase in labour productivity, manufacturing and income per capita, especially in the countries that were badly endowed with coal deposits, but enjoyed better opportunities for the production of electricity.

Concha BetrÔn. "Natural Resources, Electrification and Economic Growth from the End of the Nineteenth Century until World War II". Revista de Historia Económica, 2005.

Most British Blondes Are Fake

October 23, 2011

Why we're all dyeing to be blonde; SHOCK AS 80 PER CENT OF WOMEN WITH GOLDEN HAIR ADMIT THEY FAKE IT.


By Jill Foster and Jane Simon
The Mirror
May 19, 2004

IT'S a debate which has raged since the dawn of hair-dye — who has more fun, blondes or brunettes?

It would seem that, for British women at least, the answer is to reach for the bleach.

Four out of 10 women in the UK are blonde but more than 80 per cent are faking it, according to a survey published yesterday.

And there are regional differences, too.

Manchester has the highest proportion of blondes, real or fake, with 45 per cent of women in the northern city golden haired.

Bournemouth has the highest proportion of bottle blondes — only eight per cent of blondies in the southern seaside town are natural.

[...]

BRITAIN'S FAIR CITIES

CITY - % OF BLONDES (% NATURAL)

Manchester - 45 (24)
Bournemouth - 43 (8)
Birmingham - 43 (21)
Newcastle - 40 (23)
London - 39 (19)
Brighton - 38 (25)
Cardiff - 36 (1)

Link

Western Europe's Attitudes About Immigration

September 29, 2011

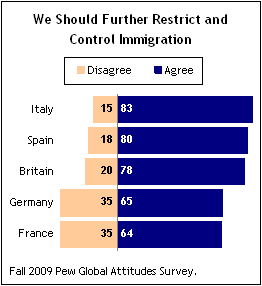
These are the results of two recent surveys about immigration conducted in Italy, Spain, France, Britain, Germany and Sweden as part of the Pew Global Attitudes Project.

Italy was the only country of the Western European nations surveyed where a majority viewed the impact of immigrants negatively. Publics in Britain, France, Germany and Spain were divided, while the Swedes had an overwhelmingly positive view of the influence immigrants had on their country.

While the recent anti-immigrant violence has been directed at Africans, Italians expressed equally negative views of immigration from Eastern European countries as they do about immigration from the Middle East and Africa. Two-thirds said it was a bad thing that people from the Middle East and North Africa come to live and work in Italy; an equal number said the same about immigrants from Eastern Europe.

Only about one-in-five Italians saw immigration from the Middle East and Africa and Eastern Europe as a good thing for Italy (20% and 22%, respectively).

Germans were also largely unwelcoming of immigrants. Solid majorities in Germany said it was bad that people from the Middle East and North Africa (64%) and from Eastern Europe (58%) moved to their country.

Opinions were more mixed in Spain and France, while many more in Britain and Sweden said immigration from the Middle East and North African and from Eastern European countries was a good thing than said it was a bad thing.

[...]

A fall 2009 survey found that more than eight-in-ten Italians (83%) agreed that "we should restrict and control entry into our country more than we do now," including 40% who completely agreed with the statement.

Majorities in the other Western European countries included in the 2009 poll also expressed support for tougher restrictions on immigration. About eight-in-ten in Spain (80%) and Britain (78%) shared that view, as did 65% in Germany and 64% in France.


Juliana Menasce Horowitz. "Widespread Anti-Immigrant Sentiment in Italy". Pew Global Attitudes Project, 2010.

Related: Italians Are Anti-Immigration and Pro-Italy

Potatoes Enabled the Industrial Revolution

July 26, 2010

Michael Pollan, in The Botany of Desire, traces the cultural shift from South to North in Europe to the introduction of the potato:

When the potato got to Europe, it changed the course of European history. Before the potato, the northern tier of Europe, the population was relatively small and was held back by regular famines caused by failures of the grain harvest.

The further north you go, the dicier it is to grow wheat. And so the center of gravity in Europe, before the potato, was the Mediterranean, where you could grow grain more reliably. The potato did very well at the more northerly areas. It did very well in wetter areas, and it did very well in really poor soils.

So suddenly there was this vast new source of calories that could underwrite the growth of the population, such as never would have happened without the potato.

Since one individual can grow so much food, you need fewer people in the fields to support an urban population. So it's really hard to imagine the Industrial Revolution proceeding as it would without the potato to kind of support it. This New World food remade the Old World.

Related: Geography and Industry

United States' North-South Achievement Gap

June 28, 2010

As in Modern Europe, achievement in the USA since its founding has been concentrated in just a few places, which has created a North-South gap that correlates with economic and educational disparities observed today. Nordicists are quick to jump on this sort of thing elsewhere but ignore it in their own backyard, or try to blame it on minorities, like the South's large black population. But Charles Murray, in his book Human Accomplishment, doesn't fail to note the gap, and the fact that it exists within the white population:

The geographic distribution of significant figures from the United States reflects the rapidly changing settlement of the country. The East Coast dominates, inevitably, because hardly anyone lived anywhere else for much of the nation's history. If I could show you a map of America's significant figures in the last half century, it presumably would look much different from the first half of 20C, just because the population shifted so radically westward throughout 20C. With that in mind, the figure below is offered as a summary of the story from the founding to 1950.


The states that are colored represent the origins of 90 percent of the American significant figures. The small dark blue slice running in an arc from Portland, Maine, to the southern tip of New Jersey encompasses the origins of about 50 percent of them. The light blue wedge encompasses another 25 percent, and the gray fills out the remaining 15 percent. Even after factoring in the history of American expansion, the primary concentration along the northeastern coast of the United States and the secondary concentration in the belt stretching to the Mississippi is striking.

An even more striking aspect of the map is the white space covering the American South. Although more lightly populated than the North, the American South had a substantial population throughout American history. In 1850, for example, the white population in the South was 5.6 million, compared to 8.5 million in the Northeast. In 1900, the comparison was 12.1 million to 20.6 million. By 1950, the gap had almost closed — 36.9 million compared to 37.4 million. While it is understandable that the South did not have as many significant figures as the North, the magnitude of the difference goes far beyond population. The northeastern states of New England plus New York, Pennsylvania, and New Jersey had produced 184 significant figures by 1950, while the states that made up the Confederacy during the Civil War had produced 24, a ratio of more than 7:1.

The scatter plots on the following page show the way in which the American significant figures break down over the three half centuries from 1800-1950.

Underperformance of Poor White British Boys

June 2, 2010

The GCSEs are national achievement exams in the U.K. that are similar to the international PISA tests Richard Lynn uses to "calculate" IQ and advance his theories about racial, ethnic and sex differences in intelligence. They're even referenced in one of his sources, but I wonder if he's aware of how badly poor white boys do on them, even compared to nonwhite students from similar disadvantaged, working-class backgrounds.

Here's a chart showing rates of underperformance on GCSE exams by ethnic group and economic status (free school meal eligibility), followed by excerpts from several related articles run by BBC News over the past few years:


Poor white boys struggle in GCSEs

Tuesday, 15 December 2009

Poor, white, teenage boys in England have slipped further behind other youngsters in their GCSE exams, reveals a breakdown of this year's results.

The official figures show that fewer than one in five who qualified for free meals achieved the benchmark of five good GCSEs including English and maths.

Twice as many white boys from better-off homes, not eligible for free meals, achieved this level of results.

[...]

Girls are still outperforming boys in achieving the GCSE benchmark — 54.5% to 47.3% — but the gap has narrowed this year by 0.9 of a percentage point.

Black pupils have also improved their GCSE results at a rate that is faster than average — rising to 41.5%.

There has also been a narrowing of the difference between poorer pupils and those who are better off — as defined by eligibility for free school meals.

But this still remains a substantial divide — with 54.4% of pupils not eligible reaching the level of five good GCSEs including maths and English, while only 26.9% of free school meal pupils achieved this.

The results show the intersection of different factors — gender, race, English as a second language and poverty.

But the group of white boys who qualify for free meals is unusual for falling further behind.

The gap between these pupils and their classmates who do not receive free meals has widened from 29.8% to 31.6%.

These results echo findings last month from an analysis of primary school results which found that poor white boys had fallen below almost every other category of pupil.

Link

Poor white boys do worst in tests

Thursday, 19 November 2009

White boys from poorer homes now do worse in primary school tests in England than any other main group, latest figures show.

Only 48% of white British boys eligible for free school meals achieved the expected level in English and maths.

The average for all pupils was 71.8% — and that gap, 23.8 percentage points, was up from 23.1 points last year.

Attainment varied between ethnic groups with Chinese, Irish, Indian and mixed white and Asian children doing best.

[...]

Last year 52.5% of white British boys and girls together had the worst performance, though the girls' attainment was 55.4%.

This year, as a group, white British pupils again did worst.

Again it was the boys' performance that was weaker than the girls'. While 55% of girls achieved the expected level they were outperformed by the next nearest group — Pakistani girls (57.4%).

[...]

There are almost 200,000 white British boys, of whom 31,237 (16%) were from homes poor enough to qualify them for free school meals.

In the past, poor black boys have tended to have the weakest performance.

But this year 51.6% of black boys on free meals made the grade and the gap in their attainment compared with the national average, 20.2, was down from 21.8 in 2008.

Attainment was 49.7% among the weakest group of black boys, those from Caribbean backgrounds.

This left the white British boys on free school meals at the bottom. Even worse for the government is the fact that the attainment gap widened.

This has been a persistent problem for ministers.

Research shows that even children from affluent families who started out in the bottom ability group as toddlers overtake those from the poorest backgrounds who started out in the top ability group, by the time they are six or seven.

LEVEL 4 ENGLISH AND MATHS, FREE SCHOOL MEALS

• All pupils: 53.3%
• White British boys: 48%
• Black Caribbean boys: 49.7%
• Asian boys: 58.7%
• White British girls: 55%
• Pakistani girls: 57.4%

Link

Poor white boys still lag behind

Thursday, 11 December 2008

Five out of six poor white boys in England did not meet the government's target of at least five good GCSEs including English and maths this year.

This compares to 25% of black boys and 32% of Asian boys of similar backgrounds, the new figures show.

Only one group performed worse — Gypsy/Romany pupils on free school meals.

Schools minister Jim Knight said the groups where children were doing well often shared a belief in the "value of family and education".

[...]

Liberal Democrat children's spokesman David Laws said: "Over half of poor Chinese boys achieve the five A*-C standard.

"Urgent questions must be asked about why white boys from similarly deprived backgrounds are falling behind."

Link

White working class boys failing

Thursday, 31 January 2008

Government figures show only 15% of white working class boys in England got five good GCSEs including maths and English last year.

Among white boys from more affluent homes — 45% achieved that level of qualification.

Poorer pupils from Indian and Chinese backgrounds fared much better — with 36% and 52% making that grade respectively.

[...]

"To have 85% of white boys from poor families failing to achieve five good GCSEs including English and maths is truly shocking."

Link

Low attainers 'poor white boys'

Friday, 22 June 2007

Most of the persistent low achievers in England's schools are poor and white, and far more are boys than girls, a Joseph Rowntree Foundation study says.

Chinese and Indian pupils are most successful. Afro-Caribbean pupils do no worse than white British from similar economic backgrounds, results suggest.

[...]

The authors, Robert Cassen and Geeta Kingdon, analysed official data, focusing on four measures of low achievement:

• no passes at all in GCSE/GNVQ exams
• no result better than grade D
• no pass in either English or maths GCSE
• not getting five GCSEs including English and maths at any grade

Prof Cassen also visited schools and colleges and interviewed educationists and council officials.

The chief characteristic of low achievers is that they come from disadvantaged backgrounds.

They are more likely to qualify for free school meals, live in areas of high unemployment, and have single parents who themselves have poor qualifications.

Link

White boys 'trailing at school'

Wednesday, 15 November 2006

Boys from white working-class backgrounds are doing worse at school than black teenagers, according to a Conservative Party report.

The document from the party's social justice policy group says only 17% of white male students gained five or more A*-C grade GCSEs.

That compares with 19% for boys of Caribbean origin, Tories suggest.

[...]

It compared the exam performance of boys in receipt of free school meals from different ethnic backgrounds.

It suggests that social issues, such as a lack of parental support, peer pressure and family breakdown are contributing to white working-class teenagers' poor exam results.

But the report adds that black teenage boys are affected by similar factors, yet are performing marginally better at school.

[...]

"The fact that poor children from Chinese and Indian backgrounds, where family structures are strong and learning is highly valued, outscore so dramatically children from homes where these values are often missing, suggests that culture not ethnicity or cash is the key to educational achievement."

Link

Richard Lynn on Italian "IQ"

March 1, 2010

Controversial psychologist Richard Lynn, who looks at IQ and its correlates, has published a study claiming to show regional (North-South) differences in intelligence within Italy, which he attempts to correlate with achievement and attribute to admixture. The guy's been called just about every name in the book, and he can now add Padanian Nordicist to that list.

Intelligence


Generally speaking, Lynn is not to be trusted. He's been caught numerous times falsifying and manipulating data to fit his conclusions (e.g. here, here, here, here, here and here), and it looks like he's up to his old tricks again.

This time around, he's not even using actual IQ data, but the proxy of scores on reading, math and science tests administered to 15-year-olds (PISA 2006). So he's attempting to quantify innate general intelligence by looking at the academic performance of school kids, a measure that to a large extent involves learned knowledge and other factors. Indeed, while some researchers report a strong correlation between general intelligence and educational attainment, one of Lynn's own sources, Deary et al. (2007), addressing two of his other sources, suggests that caution should be exercised when attempting to equate the two:

There are various possible causes of the cognitive ability-educational achievement association. Bartels et al. (2002b) found a strong genetic correlation between cognitive ability (measured at 5, 7, 10, and 12 years) and educational achievement at age 12. In an overview, Petrill and Wilkerson (2000) concluded that genetics and shared and non-shared environmental factors all influence intelligence and education, with genetics being important in the correlation between them, and non-shared environment being important in discrepancies between intelligence and educational attainments.

Whereas the correlations indicate that around 50% to 60% of the variance in GCSE [General Certificate of Secondary Education] examination points score can be statistically explained by the prior g [general intelligence] factor, by the same token a large proportion of the variance is not accounted for by g. Some of the remaining variance in GCSE scores will be measurement error, but some will be systematic. Thus, non-g factors have a substantial impact on educational attainment. These may include: school attendance and engagement; pupils' personality traits, motivation and effort; the extent of parental support; and the provision of appropriate learning experiences, teaching quality, school ethos, and structure among other possible factors (Petrides, Chamorro-Premuzic, Frederickson, & Furnham, 2005; Strand, 2003).

But Lynn already knows the pitfalls of his approach. Finland had the highest score in Europe on the 2006 PISA tests, and using his method leads to a calculated IQ of 107, yet he reports Finns' IQ as being just 97. Romanians' PISA score is near the very bottom of Europe, leading to an estimate of 85, though their measured IQ is in fact 94 according to Lynn, just three points lower than that of Finns. With discrepancies like that, there's absolutely no reason to trust his calculated IQs of around 100 and 90 for Northern and Southern Italians. Clearly, PISA scores are not a good substitute for IQ.

Then, to try to prove that disparities in intelligence are long-standing, and therefore genetically based, he uses literacy as another (questionable) proxy for IQ. But whereas for other correlates like stature and infant mortality he includes data from the past and present to show that the North-South gap has remained fairly stable, for literacy he only includes data from 1880, when it was extremely large (55% vs. 20%, on average). Obviously, he wants to hide the fact that the gap has been closing steadily since then, and by the 21st century, literacy among Italians under the age of sixty-five was 99.7% in the North and 99% in the South (Istat 2001).

Achievement


Lynn goes on to attempt to correlate his fake IQs with achievement. The primary measure he uses is per capita income, which is double in the North what it is in the South. His source is the Italian Statistical Office, but he should be aware that figures for the South's economic performance are greatly underestimated because the official statistics fail to take into account a large underground economy there, according to Burnett and Vaccara (1999):

But the third factor, somewhat alleviating the second, is the existence of a far vaster private sector than ever shows up in the economic statistics. The size of the lavoro nero sector and the black market in the South clearly exceeds that of any other EU region.... In Calabria, with its dire employment figures, 84 percent of the families own their own home. What such anomalies must mean is that real income in Calabria is far higher than what is "on the books." Many among the vast numbers of officially unemployed are, in fact, partly or fully employed. They are earning no social benefits, but they are earning the daily lire that keep their families afloat. [...] A very large part of the South's hidden labor is made up of entrepreneurs, sometimes also employing black labor, and existing themselves outside official recognition, taxation, protection, control, or counting. A recent analysis concludes that "there exists in several zones of the Mezzogiorno [Southern Italy] a whole fabric of small and very small businesses that escape every census, but that work and make profits, share among themselves a serious level of production, export to other regions [of Italy] and abroad." [...] This massive sector skews all the statistics. It means that the GDP for the Italian South (and for Italy as a whole) is far from accurate. And the unemployment figures do not reflect reality.

Then, with the same goal of establishing a pattern that extends far back in time, he also looks at historical achievement, citing Charles Murray's Human Accomplishment. But here again he plays fast and loose with the data. He adds up Murray's "significant figures" for Italy from 1400-1950 and divides them into "North", "Center" and "South" based on their origins. Almost all of them (187 out of 236) come from the "North". However, he explains that he uses the 42nd and 41st lines of latitude as borders, which are, respectively, just north of Rome and just north of Naples. So more than half of the country is put into the "North" category, while the "Center" gets flattened down and pushed into the territory of the "South" (click here to see what that looks like). This is a shameless and transparent ploy by Lynn to hugely inflate the number of significant figures from the "North" and reduce the number elsewhere in the country.

But perhaps even worse, he ignores the main finding of Murray's book, which is that achievement has been concentrated in just a few places, and Southern Italy is but one of many "low-achievement" areas throughout Europe, along with some of the northernmost regions in Italy:


As you can see — and as Murray points out in his book — the highest ranking region is Tuscany, which would normally be considered part of Central Italy. Ironically, Lynn doesn't even have PISA/IQ data for Tuscany, though its 1880 literacy rate isn't particularly high. So he's basically attributing the unique genius of that region to the brainpower of regions that have not produced the same level of genius.

Admixture


Finally, Lynn offers his "explanation" for the disparities in fake IQ, which, unsurprisingly, turns out to be admixture from the Middle East and North Africa, where (according to him) IQs are in the range of 80-84. As you might expect from someone with an agenda and little knowledge of genetics, he references a lot of old studies that use single or small numbers of loci and don't directly address the question of admixture. One of them has "Neolithic demic diffusion in Europe" in its title, yet he stupidly follows the citation with references to historical groups like Phoenicians and Arabs.

Recent genome-wide studies have been able to detect and quantify admixture like never before. Li et al. (2008), using more than 600,000 autosomal SNPs, identify seven global population clusters, including European, Middle Eastern and Central/South Asian. Contrary to Lynn's claims, it's actually the overachieving Tuscans who have a small amount of non-European admixture and not the underachieving Sardinians:


López HerrÔez et al. (2009) typed the same samples at close to 1 million SNPs and analyzed them in a Western Eurasian context, identifying a number of subclusters. This time, all of the European samples show some minor admixture. Among the Italians, Tuscany still has the most, and Sardinia has a bit too, but so does Lombardy (Bergamo), which is even farther north:


Conclusion


The bottom line is, we don't know the average IQs for different regions in Italy, which is why Richard Lynn had to resort to making them up. And while Southern Italians are likely to be a few points lower than Northern Italians — as the Irish and Scottish are a few points lower than the English — there's absolutely no reason to believe that North and South would be separated at their extremes by almost a full standard deviation. Lynn certainly hasn't proven anything of the kind with this ridiculous study, nor has he provided any valid explanations for such a disparity.

Updates


Since I wrote this article, a number of studies have been published that refute Lynn and confirm what I've said:


---------------
Richard Lynn. "In Italy, north-south differences in IQ predict differences in income, education, infant mortality, stature, and literacy". Intelligence, 2010.

Dinaric Alps Home to Tallest Europeans

October 6, 2007

Average height of adolescents in the Dinaric Alps


Pineau et al. (2005)
C R Biol

ABSTRACT: This study contributes to an update of average heights among European populations. Our investigation covering 2705 boys and 2842 girls aged 17 years, shows that, contrary to the general belief, adolescents of the Dinaric Alps are, on average, the tallest in Europe. With an average height of 185.6 cm, they are taller than Dutch adolescents (184 cm on average). Above all, the density of very tall subjects appears to be characteristic of the Dinaric Alps, since 28% measure 190 cm or more in height, as opposed to only 20% in Holland and 1.5% in France. Although our information is not complete, adolescent girls in the Dinaric Alps, with an average height of 171 cm, come a close second to girls in Holland.

[NB: Samples were taken from six locations in Dalmatia (southern Croatia) and three in Herzegovina.]

Link

Demographic Impact of Roman Slavery Revised

December 22, 2006

Excerpt from:

Rome at War: Farms, Families, and Death in the Middle Republic


by Nathan Rosenstein

Copyright (c) 2004 by the University of North Carolina Press. All rights reserved.

Recent studies of Italian demography have further increased doubts about a rapid expansion of the peninsula's servile population in this era. No direct evidence exists for the number of slaves in Italy at any time.[39] Brunt has little trouble showing that Beloch's estimate of 2 million during the reign of Augustus is without foundation.[40] Brunt himself suggests that there were about 3 million slaves out of a total population in Italy of about 7.5 million at this date, but he readily concedes that this is no more than a guess.[41] As Lo Cascio has cogently noted, that guess in effect is a product of Brunt's low estimate of the free population in Italy in A.D. 14.[42] That is, Brunt must assume that the slave population had come to comprise nearly 40 percent of the population of Italy by the time of Augustus because he believes that the nonservile population of Italy had only managed to stay even between 225 B.C. and A.D. 14.[43] At the same time, however, the number of residents of cities and towns throughout the peninsula and especially of Rome itself was skyrocketing. Consequently, without the supposition that slaves made up a very high percentage of the total population, not enough people would have been left in the countryside to produce the food needed to feed those in the towns. The basis for the supposition that slaves in Italy numbered as many as 3 million by the reign of Augustus in other words really consists of nothing more than a kind of elaborate circular argument in which the low free population "explains" the high number of slaves, which in turn "explains" how there could be so few free men and women in Italy.[44]

Brunt also advances the claim that the Romans owned about 500,000 slaves circa 212, which suggests that, in his opinion, the slave population of Italy might have seen an average annual net gain between then and the end of the first century B.C. of perhaps 12,500 individuals. But the starting point for postulating such a rapid rate of increase is also based on a similar piece of guesswork. After noting that, by his reckoning, the Romans had mobilized about 11 percent of their free population in that year and mentioning the comparisons that other scholars had made to the 10 percent of their populations that some Balkan states in 1913 and Germany in 1914 had mobilized, Brunt continues, "We have only to suppose that the Romans owned not far short of half a million slaves to reduce the proportion of men in the armies and fleets far below 10 percent, even after allowing that 20,000-30,000 slaves may have been used after 214 as rowers."[45] In other words, a slave population of 500,000 is necessary to bring the ratio of men under arms to the civilian population down into a range that Brunt finds acceptable. He makes no attempt to discover what might constitute a maximum rate of mobilization for a society such as Rome's in this period except to state that productivity per person was lower than in Germany and the war lasted longer than the modern conflicts. Of course, the cost of equipping and maintaining an army was much lower for the Romans as were the economic requirements of the civilian population. And one might suppose that more men could be spared from a simple agrarian economy like ancient Rome's than from a complex industrial one like early twentieth-century Germany's.

Consequently, Brunt's figures offer no basis for assuming that a dramatic rise in the number of Roman slaves—and hence in the number of the plantations that employed them—was getting under way during the early second century. To be sure, Livy records a depressing litany of enslavements by Roman armies in the course of their conquests in this period.[46] But it does not necessarily follow that these would have helped bring about the sixfold increase in the Roman slave population by the reign of Augustus that Brunt postulates. Given the usual assumption in modern scholarship that male slaves significantly outnumbered females, the slave population would have been incapable of reproducing itself at full replacement level.[47] As a result, the Romans regularly had to import substantial numbers of new slaves just to keep the slave population from shrinking. Scheidel has shown that on the assumption that slaves in 225 numbered 500,000 and were declining by only 1 or 2 percent per year, far more new slaves would have been required simply to replace current slaves who died than to generate a net increase of 2.5 million in the total slave population by 25 B.C.[48] As large as the enslavements of this period were, therefore, they cannot in and of themselves demonstrate a rapid rise in Italy's slave population along the lines Brunt supposes. It is also worth bearing in mind that not all of those whom Rome's armies captured will have wound up in Italy, for this by no means constituted the only market for slaves in the early second century. Agriculture and manufacture in Carthage, Sicily, and elsewhere in the Hellenistic world made extensive use of slave labor, and the same factors of imbalanced sex-ratios and low birthrates that created a very high demand for replacement slaves in Italy may well have been operating in these areas also.[49]

However, one piece of negative evidence, to which Scheidel has also drawn attention, provides an intriguing hint that conventional estimates of slaves making up as much as 40 percent of Italy's population by the late first century B.C. may be far too high.[50] An analysis of the genetic makeup of Italy's modern population argues that the various distinctive genetic combinations currently found in different regions within the peninsula by and large track the linguistic distribution that resulted from the migrations of the Iron Age.[51] No data indicate the subsequent large-scale infusion of new genetic material into the populations of these regions except in the case of southern Italy and eastern Sicily, which is explained by the well-documented Greek migrations there. If this finding is correct, then the slave population of Italy even at its greatest extent must have been far smaller than Brunt imagined, perhaps no more than a million. Otherwise, one must suppose that a very large number of slaves existed but made no contribution to the peninsula's genetic composition because they simply failed to reproduce themselves. Yet a very large number of slaves, on the order of 3 million, presupposes that this population was fairly successful at reproducing itself because it could never have reached that size in the first place and then maintained those numbers for centuries through imports alone. As already noted, the majority of new slaves brought into a servile population that was not reproducing itself completely would only have replaced old slaves who had died. But if a population of 3 million slaves, representing as much as 40 percent of Italy's inhabitants in the first century B.C., was successfully reproducing itself, it would surely have left its mark on the genetic makeup of contemporary Italians. That it did not argues strongly for a very low rate of natural reproduction among Italy's slaves, which in turn is difficult to reconcile with the hypothesis that the number of slaves ever grew large enough to comprise 40 percent of the Italian population.

If a dramatic rise in Italy's servile population during the second and first centuries is beginning to appear increasingly questionable, the decline in the numbers of free men and women that is supposed to have been its corollary is also being viewed with a growing skepticism. The census returns of 70 and 28 B.C. represent the linchpin for this pessimistic assessment of the condition of Italy's smallholders. For many years Brunt's powerful defense in Italian Manpower of Beloch's view that these totals demonstrate a drop in the free population of Italy remained unchallenged, even though the numbers themselves, around 900,000 in 70 and over 4 million in 28, would seem to reflect precisely the reverse. But Beloch and Brunt argue that the latter figure represents free men, women, and children, whereas the censors in 70 had counted only adult male citizens. When the totals are adjusted and allowances made for enfranchisements between 70 and 28 and citizens overseas, the result is a net decline in the free population.[52] When these figures are in turn compared with the census returns of 225, the general regression in Italy's free population becomes patent, a regression that Brunt traces to the damage that Rome's wars and the importation of slaves inflicted on Italy's farmers.[53]

In a provocative article, Lo Cascio has asked how it is possible to make demographic sense out of the Beloch-Brunt thesis.[54] The argument they advance must assume that the population between 70 and 28 was declining annually by .5 percent, and the implications of such a decline, Lo Cascio believes, are unacceptable. Beyond question, the urban population of Italy increased dramatically during the middle of the first century, and any rise in urban numbers, with the possible exception of Rome itself, had to come from the rural population. In the preindustrial world, however, an urban population does not grow without a sustained growth in the rural free population whose economic products support it. Thus Lo Cascio argues that unless we are prepared to suppose that the ratio of urban to rural dwellers in Italy between 70 and 28 was far in excess of preindustrial norms—and there is no good reason to do so—the Beloch-Brunt interpretation of the census total for 28 cannot be made plausible. For it must assume that a dramatic and unparalleled drop in Italy's nonurban population was occurring at a time of unprecedented urban growth. Consequently, the figure of 4 million must represent only adult, male citizens just as had been the case in earlier republican censuses. If that is so, then as Tenny Frank long ago argued, the free population of Italy must have been growing vigorously during the second and first centuries.[55]

Lo Cascio's article certainly will not be the final word on the controversy surrounding Beloch's and Brunt's thesis, but the mere fact that this critical prop is now being challenged renders claims about a crisis among Italy's small farmers due to war and the introduction of plantation agriculture all the more open to question.[56] From a different perspective, Morley, too, has raised additional doubts about the conventional view. He notes that the populations of early modern cities generally could not reproduce themselves; they depended instead upon a large, steady influx of immigrants from the countryside to reach and then to maintain their size. Rome, he believes, would have been no different. Therefore the swelling of the city's inhabitants to nearly a million over the course of the second and first centuries B.C. and the stability of their numbers at roughly that level over the ensuing centuries cannot be attributed to a single, discrete event like the displacement of smallholders after the Hannibalic War. Such an episode would create a temporary increase, but then the process would slow, perhaps even reverse course, and the city would shrink as its population gradually died off.[57]

Link

Most Violent Countries

September 21, 2005

Scotland tops list of world's most violent countries


By Katrina Tweedie
Times Online

September 19, 2005

A UNITED Nations report has labelled Scotland the most violent country in the developed world, with people three times more likely to be assaulted than in America.

England and Wales recorded the second highest number of violent assaults while Northern Ireland recorded the fewest.


The study, based on telephone interviews with victims of crime in 21 countries, found that more than 2,000 Scots were attacked every week, almost ten times the official police figures. They include non-sexual crimes of violence and serious assaults.

Violent crime has doubled in Scotland over the past 20 years and levels, per head of population, are now comparable with cities such as Rio de Janeiro, Johannesburg and Tbilisi.

The attacks have been fuelled by a "booze and blades" culture in the west of Scotland which has claimed more than 160 lives over the past five years. Since January there have been 13 murders, 145 attempted murders and 1,100 serious assaults involving knives in the west of Scotland. The problem is made worse by sectarian violence, with hospitals reporting higher admissions following Old Firm matches.

David Ritchie, an accident and emergency consultant at Glasgow's Victoria Infirmary, said that the figures were a national disgrace. "I am embarrassed as a Scot that we are seeing this level of violence. Politicians must do something about this problem. This is a serious public health issue. Violence is a cancer in this part of the world," he said.

Detective Chief Superintendent John Carnochan, head of the Strathclyde Police's violence reduction unit, said the problem was chronic and restricting access to drink and limiting the sale of knives would at least reduce the problem.

The study, by the UN's crime research institute, found that 3 per cent of Scots had been victims of assault compared with 1.2 per cent in America and just 0.1 per cent in Japan, 0.2 per cent in Italy and 0.8 per cent in Austria. In England and Wales the figure was 2.8 per cent.

Scotland was eighth for total crime, 13th for property crime, 12th for robbery and 14th for sexual assault. New Zealand had the most property crimes and sexual assaults, while Poland had the most robberies.


Chief Constable Peter Wilson, president of the Association of Chief Police Officers in Scotland, questioned the figures. "It must be near impossible to compare assault figures from one country to the next based on phone calls," he said.

"We have been doing extensive research into violent crime in Scotland for some years now and this has shown that in the vast majority of cases, victims of violent crime are known to each other. We do accept, however, that, despite your chances of being a victim of assault being low in Scotland, a problem does exist."

Link

Argentinean Italians Are Mostly Southern

September 9, 2005

Migration from Southern Italy to Argentina: Calabrians and Sicilians (1880-1930)


Cacopardo et al. (1990)
Studi Emigr

ABSTRACT: The study analyzes Italian emigration to Argentina from Sicily and Calabria between 1880-1930, compared with out-migration flows from Piedmont. The concepts of cultural patrimony and of migratory strategy are used to measure the different potentials and job opportunities in the Argentinean labor market as well as in the Italian context for those returning home. Considering the high proportion of returnees, a positive or negative correlation between region of origin and of destination can be proposed. Southern Italians indicate a more permanent settlement. The authors conclude that the Argentinean society in its Italian component is the result of Southern rather than Northern influences.

Link

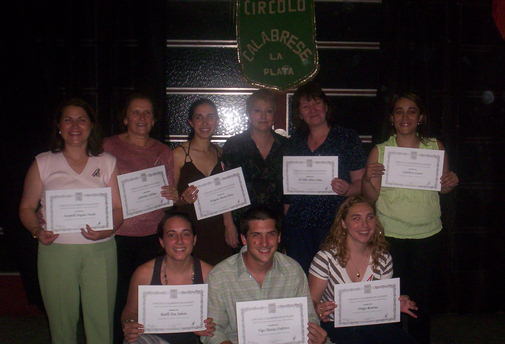
Here are some photos of the Calabrian community in Argentina (click to enlarge):


Source